What is %matplotlib inline and how to use ?
This tutorial explains the purpose of %matplotlib inline and how to use them in jupyter python notebook. Matplotlib is an amazing visualization plotting library for python programming language.
Purpose of %matplotlib inline and usage
Using matplotlib you can plot several types of graphs like line, bar, scatter, histogram etc.,. To explore matplotlib, make sure that you have downloaded Python and installed (Python download and Python Install).
After installing Python, you need to install matplotlib packages using the following command.
> python -mpip install -U matplotlib

Requirement already up-to-date: matplotlib in c:\users990\appdata\local\programs\python\python38-32\lib\site-packages (3.4.1)
Requirement already satisfied, skipping upgrade: pillow>=6.2.0 in c:\users990\appdata\local\programs\python\python38-32\lib\site-packages (from matplotlib) (8.2.0)
Requirement already satisfied, skipping upgrade: kiwisolver>=1.0.1 in c:\users990\appdata\local\programs\python\python38-32\lib\site-packages (from matplotlib) (1.3.1)
Requirement already satisfied, skipping upgrade: cycler>=0.10 in c:\users990\appdata\local\programs\python\python38-32\lib\site-packages (from matplotlib) (0.10.0)
Requirement already satisfied, skipping upgrade: python-dateutil>=2.7 in c:\users990\appdata\local\programs\python\python38-32\lib\site-packages (from matplotlib) (2.8.1)
Requirement already satisfied, skipping upgrade: numpy>=1.16 in c:\users990\appdata\local\programs\python\python38-32\lib\site-packages (from matplotlib) (1.20.2)
Requirement already satisfied, skipping upgrade: pyparsing>=2.2.1 in c:\users990\appdata\local\programs\python\python38-32\lib\site-packages (from matplotlib) (2.4.7)
Requirement already satisfied, skipping upgrade: six in c:\users990\appdata\local\programs\python\python38-32\lib\site-packages (from cycler>=0.10->matplotlib) (1.15.0)
WARNING: You are using pip version 20.1.1; however, version 21.0.1 is available.
You should consider upgrading via the 'C:\Users990\AppData\Local\Programs\Python\Python38-32\python.exe -m pip install --upgrade pip' command.
Note, if matpotlib is already installed you would see a message response saying requirement already satisfied. Otherwise it will install the required packages.
To import matplotlib you need to add the following from import or import statements on top.
from matplotlib import pyplot as plt

or

import matplotlib.pyplot as plt
What is %matplotlib inline ?
%matplotlib inline sets the backend of matplotlib to the ‘inline‘ backend. Hence when you execute matplotlib plotting commands the output will be displayed inline within Jupyter Notebook directly below the code cell where you had entered the command.
Also, the resulting matplotlib plots will be stored in the notebook document. Let’s try to understand this with example below.
%matplotlib inline – example
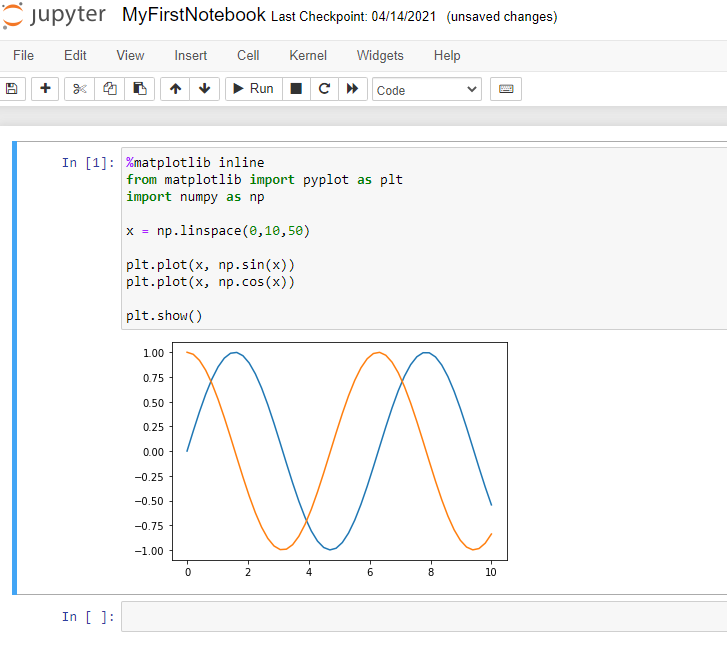
For example, to display plots inline i.e., directly below the code cell, you need to add %matplotlib inline before import statements as shown below. Type the following code in the Jupyter Notebook code cell and run. Finally, you could see that plots are created inline.
Conclusion:
Basically plotting interactively within Jupyter Python Notebook can be done using %matplotlib commands. And there are two options available
- %matplotlib notebook – will create interactive plots embedded within notebook
- %matplotlib inline – will create static images of your plot embedded within the notebook.
For instance, we will generally use % matplotlib inline command. After running this command any cell within python notebook will create a plot and embed the static PNG image of the resulted graphic in the notebook.
That’s it. You had learnt how to create static images of your plot embedded in the notebook using %matplotlib command and understood the purpose of using this command.
Hope it helped 🙂
You’ll also like:
- Increase the cell width of the Jupyter Notebook in browser
- How to include HTML within IPython Notebook ?
- Add python3 kernel to jupyter IPython notebook ?
- Reset jupyter notebook theme to default theme
- How to change the default theme in Jupyter Notebook ?
- Change the Jupyter Notebook startup folder in Windows & Mac
- To run Jupyter Notebook on Windows from command line
- Run a Jupyter Notebook .ipynb file from terminal or cmd prompt
- Amazon Linux AMI : apt-get command not found
- Linux: sudo: apt-get: command not found
- How to Start Stop Restart MariaDB on Linux OS ?
- Putty Fatal Error No supported authentication methods available
- Find which users belongs to a specific group in linux
- How to unzip a zip file from Terminal (Google Cloud Shell)
- Build a Docker Image with a Dockerfile and Cloud Build in GCP?
- Is it possible to change Google Cloud Platform Project ID ?
- Embed image in jupyter notebook from a local file or web resource
- Install Python 3 on Windows 10 machine
- Can I use multiple values.yaml files for Helm Chart ?
- TypeError: a bytes-like object is required, not ‘str’ – Python3