How to visualize Big Data using Google Data Studio ?
In our previous tutorial Data Loading you had learnt how to load big data into Google BigQuery. Now in this tutorial you will learn the tool Google Data Studio used to visualize big data.
The following are the steps required to visualize your data using Data Studio.
Launch Data Studio and create blank report
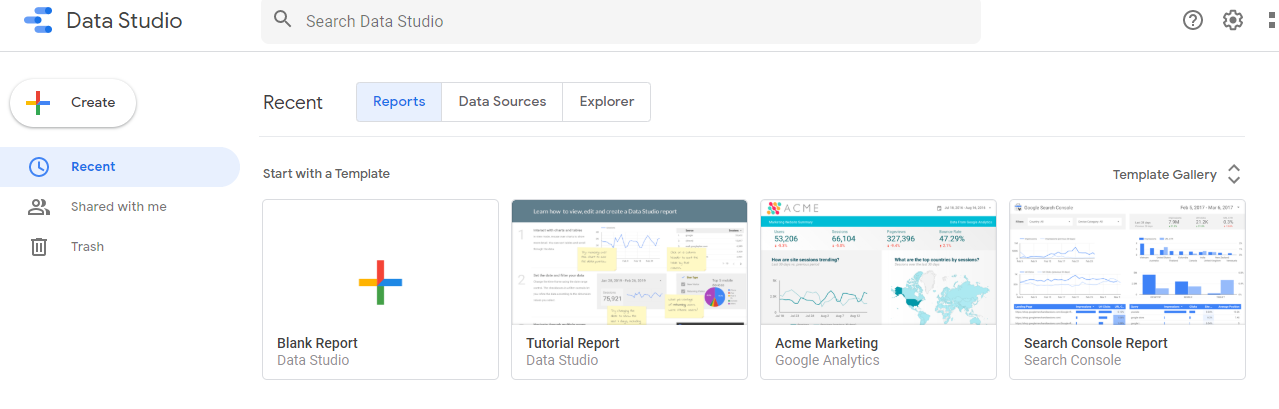
1. Open Google Data Studio and click Blank Report template.
2. A new untitled report opens. At the bottom of Select Data Source right panel, click CREATE NEW DATA SOURCE.
3. Click Authorize to allow Data Studio access to your GCP project and Allow access to your Google account
4. Then Select BigQuery under Google Connectors
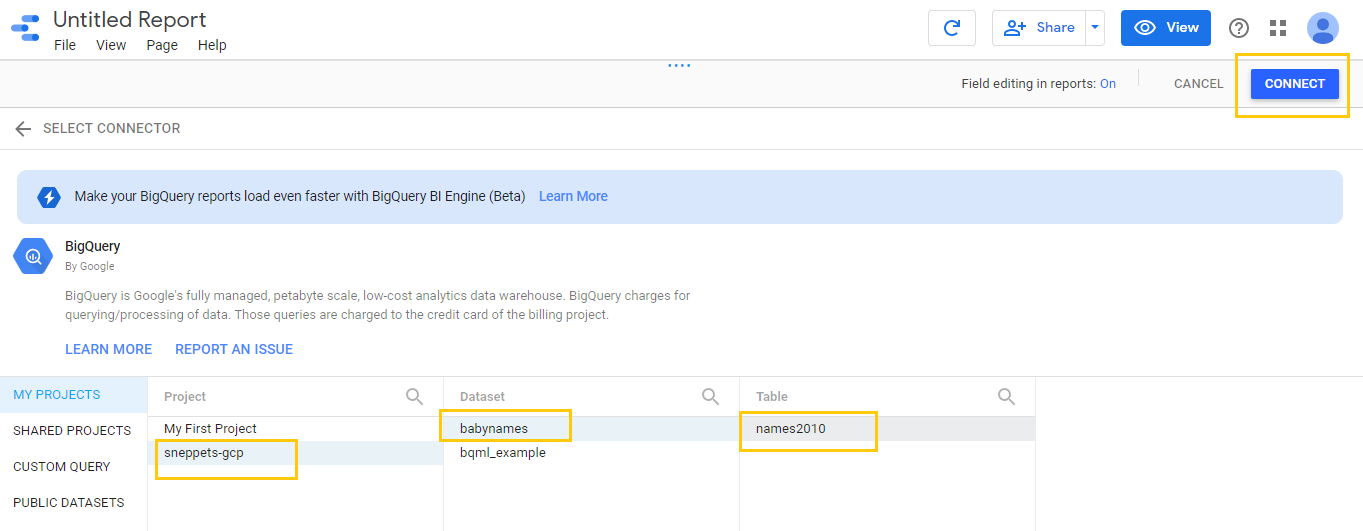
5. Then define your project and click CONNECT
Project : sneppets-gcp
Dataset : babynames
Table : names2010
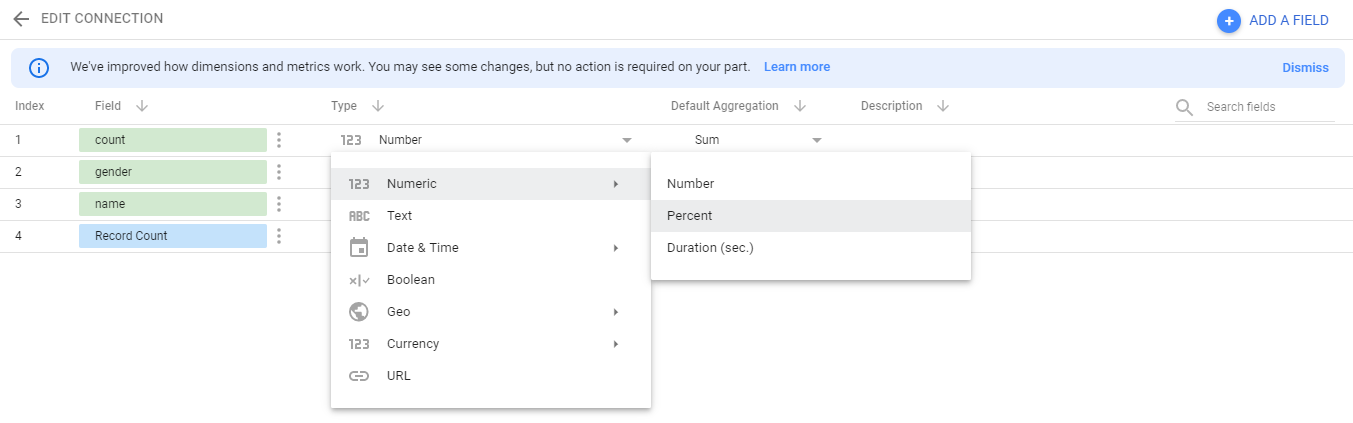
6. For the row count field, click Number -> Percent as shown below
7. Then click ADD TO REPORT in the upper right and Allow to authorize Data Studio to access your files in Google Drive, where your dashboards are stored.
Create big data visualization report
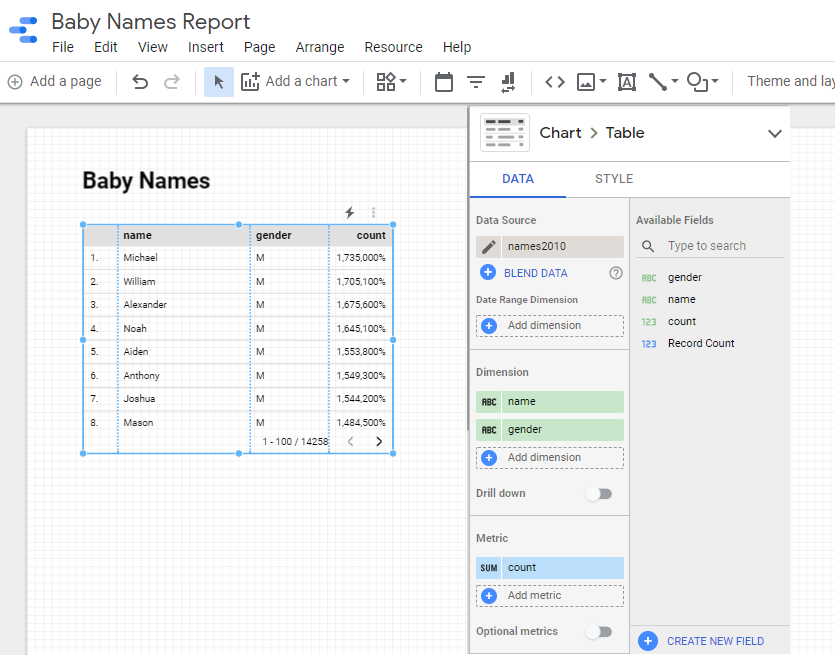
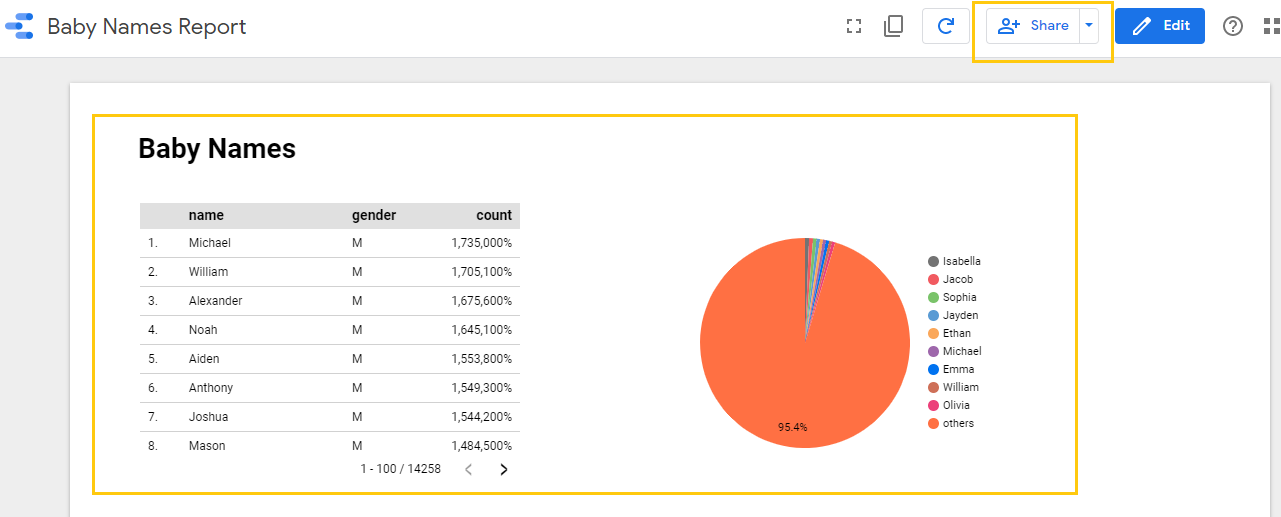
1. Add a report title and page title as “Baby Names Report” and “Baby Names”
2. Use Data and Style panel to set data and style properties that you wanted. For instance, you can add name as another dimension, remove Record count from metrics and add count as metrics as shown below
3. You can also apply filters using ADD A FILTER option in the right panel under DATA tab.
4. In the upper right hit View button to preview your report and Share with anyone as shown below
Further Learning
- Create Machine Learning model to predict online purchase conversion
- What is Data Loading and loading data into Google BigQuery ?
- Create GCP project on Google Cloud Platform
- GCP Virtual Private Cloud (VPC) Networks Fundamentals